
Visualization
Different visualization techniques are available. Each of them has different purposes and is suitable for less or higher dimensional objective spaces.
The following visualizations can be used:
Name |
Class |
Convenience |
|---|---|---|
Scatter |
“scatter” |
|
ParallelCoordinatePlot |
“pcp” |
|
Heatmap |
“heat” |
|
Petal |
“petal” |
|
Radar |
“radar” |
|
Radviz |
“radviz” |
|
StarCoordinate |
“star” |
|
Video |
Each of them is implemented in a class which can be used directly. However, it might be more comfortable to either use the factory function in some cases. For example for scatter plots the following initiates the same object:
[1]:
# directly using the class
from pymoo.visualization.scatter import Scatter
plot = Scatter()

# the global factory method
from pymoo.factory import get_visualization
plot = get_visualization("scatter")
The advantages of the convenience function is that just by changing the string a different visualization can be chosen (without changing any other import). Moreover, we desire to keep the global interface in the factory the same, whereas the implementation details, such as class names might change.
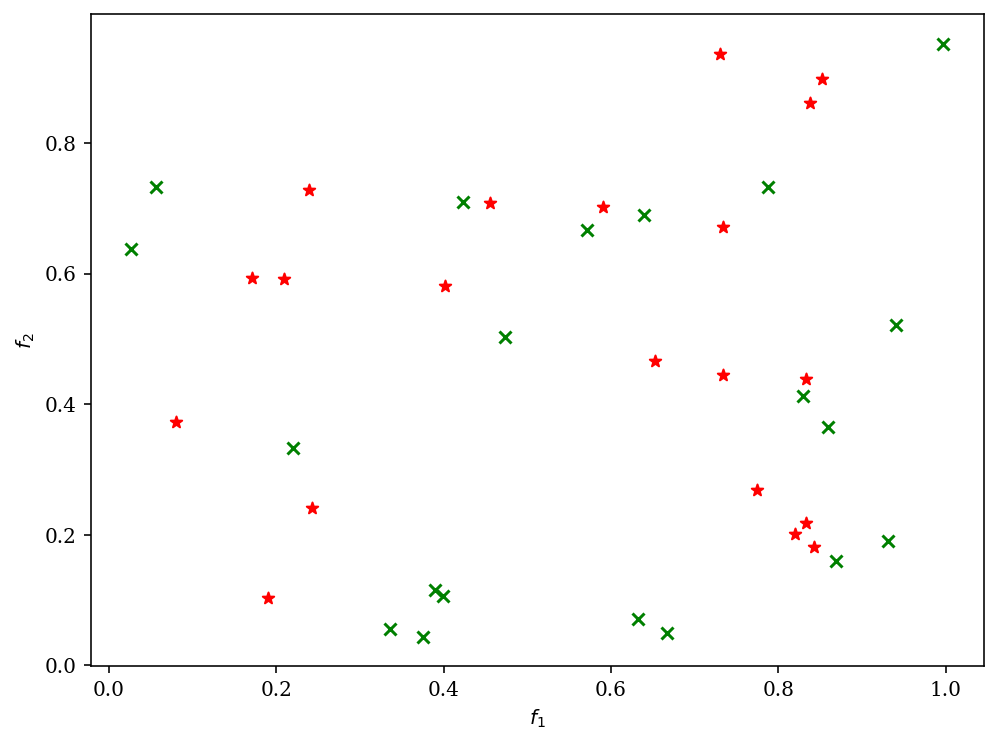
Please note, that the visualization implementations are just a wrapper around matplotlib and all keyword arguments are still useable. For instance, if two different set of points should be plotted in different colors with different markers in a scatter plot:
[2]:
import numpy as np

A = np.random.random((20,2))
B = np.random.random((20,2))

from pymoo.factory import get_visualization
plot = get_visualization("scatter")
plot.add(A, color="green", marker="x")
plot.add(B, color="red", marker="*")
plot.show()
[2]:
<pymoo.visualization.scatter.Scatter at 0x7f3486687160>
This holds for all our visualizations. However, depending on the visualization the matplotlib function that is used and the corresponding keyword arguments might change. For example, in for the PetalWidth Plot polygons are drawn which has different keywords than the plot of matplotlib.
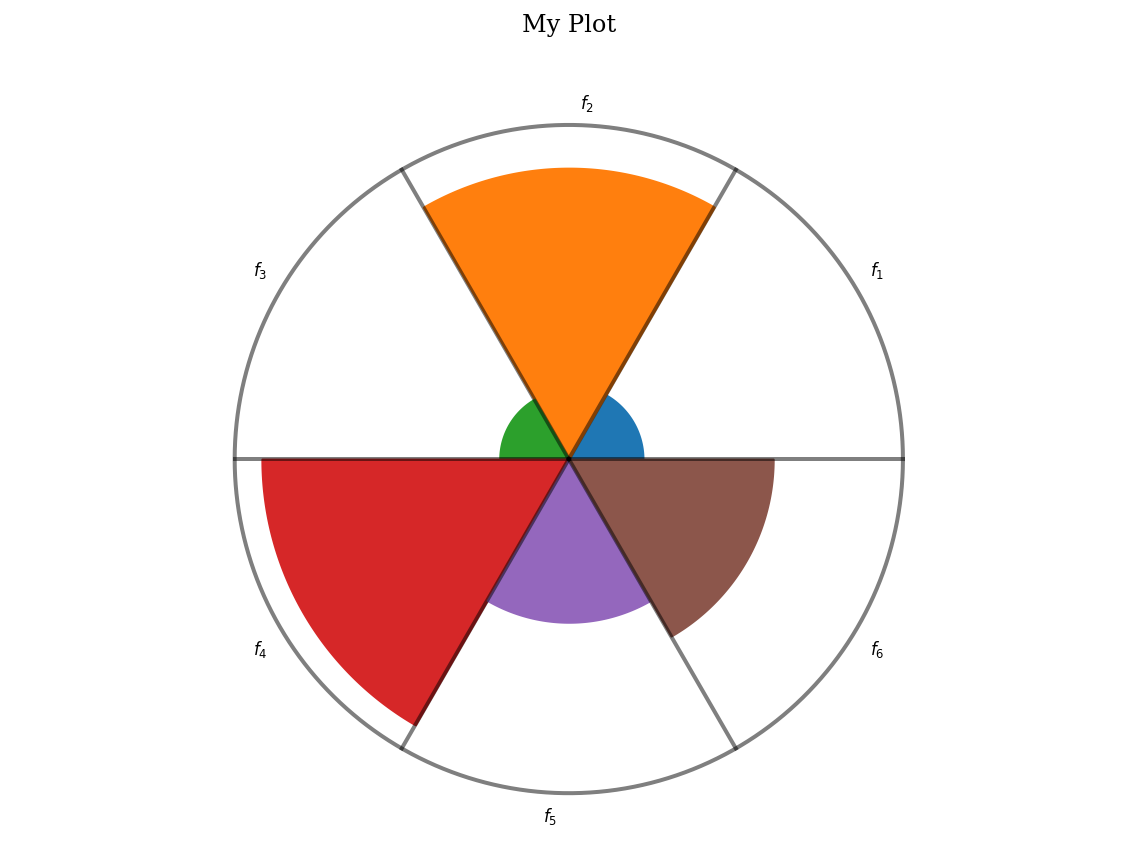
Furthermore, the plots have some default arguments to be used to set them during initialization:
[3]:
from pymoo.visualization.petal import Petal
from pymoo.visualization.util import default_number_to_text

np.random.seed(5)
A = np.random.random((1,6))

plot = Petal(

    # change the overall figure size (does not work for all plots)
    figsize=(8, 6),

    # directly provide the title (str or tuple for options)
    title=("My Plot", {"pad" : 30}),

    # plot a legend (tuple for options)
    legend=False,

    # make the layout tight before returning
    tight_layout=True,

    # the boundaries for normalization purposes (does not apply for every plot
    # either 2d array [[min1,..minN],[max1,...,maxN]] or just two numbers [min,max]
    bounds=[0,1],

    # if normalized, the reverse can be potted (1-values)
    reverse=False,

    # the color map to be used
    cmap="tab10",

    # modification of the axis style
    axis_style=None,

    # function to be used to plot numbers
    func_number_to_text=default_number_to_text,

    # change the axis labels - could be a list just the prefix
    axis_labels=["Objective %s" % i for i in range(1,7)],
)

plot.add(A, label="A")
plot.show()
[3]:
<pymoo.visualization.petal.Petal at 0x7f34b003c3a0>
For each visualization a documentation is provided.